Report
A high-level overview of your release performance

Multichannel News Release
Note:
In an individual release report, you’ll find a dedicated tab in the left navigation for Multichannel News Release (MNR). This tab provides detailed insights into how users discovered your landing page, the amount of traffic it received, and the actions they took on your branded web destination.
If MNR data is available for your release, all related widgets will be displayed. Otherwise, an upsell message will appear.
 |
Page views - Number of times that your pages are loaded in a user's browser
Unique visitors - Amount of people who visited your pages, one or more times
 |
Images
Total Image Views - The total number of times the images/animated GIFs were clicked on and viewed in the lightbox
Total Image Downloads - The total number of times the images/animated GIFs were downloaded
Image Performance
Image Performance - This section shows data for the images and animated GIFs that are hosted on your landing page. Scroll through to see metric for each image or animated GIF
Impressions - The number of times the images/animated GIFs was loaded on visitors’ screen
Shares - The number of times visitors clicked on a share icon for the images/animated GIFs
Downloads - The number of times the images/animated GIFs was downloaded by visitors.
Views - The number of times the images/animated GIFs was clicked on and viewed in the lightbox
 |
Video
Total Video Views - The total number of times visitors clicked on and viewed the videos in the lightbox
Total Video Downloads - The total number of times your videos were downloaded from your landing page
Video Performance
Video Performance - This section shows data for the videos that are hosted on your landing page. Scroll through to see metrics for each hosted video
- Impressions - The number of times the video was loaded on visitor’s screens
- Shares - The number of times visitors clicked on a share icon for the video
- Downloads - The number of times the video was downloaded by a visitor
- Views - The number of times the video was clicked on and viewed in the lightbox
 |
Audio
Total Audio Plays - The total number of times visitors clicked on and played the audio files.
Total Audio Downloads - The number of times the audio files were downloaded from the landing page.
Need text for below
Audio Performance
Audio Performance - This section shows data for the audio files that are hosted on your landing page. Scroll through to see metrics for each hosted audio file.
Impressions - The number of times the audio file was loaded on visitors’ screens.
Shares - The number of times visitors clicked on a Share icon for the audio file.
Downloads - The number of times the audio was downloaded by a visitor.
Plays - The number of times the audio file was played.
 |
PDF/Document
Total PDF/Document Downloads: The total number of times visitors have downloaded documents of any format from the landing page.
PDF/Document Performance
This section shows each time visitors downloaded a document from the landing page
 |
Shows countries where your site was accessed.
-
If you see 'Undefined' in this section, it means that we couldn't determine where the person was when the page was accessed.
- The Top Countries section will show the top five countries by default. Click the "See details" link to see a list of all countries (ordered from most views to least).
 |
Device views
- Desktop Views: This section shows the number of users who viewed your page from a desktop.
- Tablet Views: This section shows the number of users who viewed your page from a tablet device.
- Mobile Views: This section shows the number of users who viewed your page with a mobile device.
 |
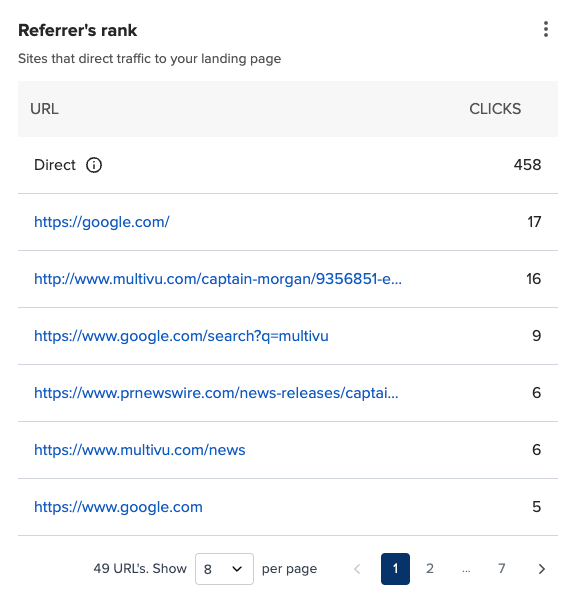
Referrers Rank
Sites that are directing traffic to the landing page. "Direct" - Say a friend or colleague sends you a URL via text message, Slack or email and you visit the URL from there. That would be registered as direct traffic. Traffic would also be marked as "direct" if someone visits the MNR from a bookmark.
 |
Click-throughs
Hyperlinks on your landing page that visitors clicked
 |
This section contains reports from any add-on distributions included in your order. Online Video Distribution (OVD) is where we upload a video that’s hosted on your landing page to MultiVu’s accounts on the top video hosting sites: YouTube, Vimeo, and DailyMotion.
This secion will link directly to the uploaded videos and track data on impressions and views.
 |
PR Newswire Asia Customer Relations Team
All customers (except Mainland China & Japan)
Email: apaccs@cision.com
Phone: +852-2572 8228
Mainland China & Japan customers
Email: cncs@prnasia.com
Phone:
+86-10-5953 9588 (Beijing)
+86-21-8017 9500 (Shanghai)
+86-755-8203 7494 (Shenzhen)
+86-28-8511-4282 (Chengdu)
+86-571-8821 9683 (Hangzhou)
+86-755-8203 7494 (Xiamen)
Print or save (as a PDF or Excel file) any page of your Visibility Reports by clicking the Print or Save icons at the top; you can also email any individual report by clicking the Email button at the top of the page.
Click the View All link whenever you see it to view the full, expanded data set within that metric.